Stockholm Tesla Coil
11 ft streamers
This page will be like a blog, I will add measurements in the order they are made
Much research and simulated waveforms, not so many actual measurements
There is much serious research done on Tesla coils in the last decades, and many simulations of waveforms based on mathematical models have been published. There are however not as much actual waveform measurements published.
Therefore I will try to make the measurments that I can, and I will publish them.
I do not have access to expensive measuring equipment, so I will have to make the best of what I have available.
Comments and critique is welcome to my e-mail adress, my knowledge of measurements is perhaps somewhat outdated, and I must admit that my mathematical understanding is very limited.
What is difficult about making waveform measurements on a Tesla coil?
One major problem is that a mains powered oscilloscope is referred to mains ground, while the Tesla coil is referred to it´s own ground. The tesla ground connection carries a lot of RF-current, and it´s potential is often at several hundred volts from the mains ground connection. This is because of the inevitable inductance of the tesla ground lead and of the ground itself. Therefore it is not possible to connect the oscilloscope ground to the tesla ground. This makes it neccessary to use differential current or voltage probes, that do not connect the different grounds, and that are immune to different ground potentials.
Radio frequency interference could also sneak in by every cable connection. A WiFi connected scope module eliminates some cabling, and battery powering of scope and active probes eliminates yet more cables. A WiFi connected scope module could be screened for the lower frequency range of the Tesla coil, but still allow the WiFi signal in the GHz range through.
And the other problem, of course, are the vast currents and voltages that are present in the tesla primary or secondary circuits. Most differential input high voltage probes are not able to handle the voltages in the tesla primary circuit. Current transformers are differential by nature, but have bandwidth limitations, as well as a limited amplitude range.
Tank capacitor voltage
The graph
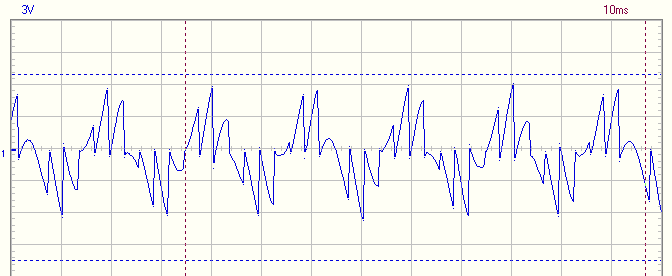
This is my primary cap voltage at 12 kV / div. A little more than six periods of the 50 Hz mains voltage can be seen on the horisontal axis. There are 43 discharges visible, that corresponds to 331 bps of the asynchronous spark gap.
This measurement was made before my charging circuit was optimised.
Would a synchronous gap be better?
I doubt that, but I must admit that the energy per half period varies by about 20 percent, depending on where the discharges happens in the half period. But one must remember that the best half periods, energywise, are a consequence of less successful half periods before and after.
A synchronous gap would allow me to place the discharges at the most favorable moments, but for the reasons mentioned above, that would not supply as much energy as my best half periods. So my conclusion is that I would probably not gain so much over my present average energy per half period. And I would have lost the opportunity to vary the bps continously, which is a great asset when trying to optimize the charging.
But at a lower bps rate a synchronous gap would be essential. If there are only one or two bangs per half period, the timing of these are critical. At higher bps the timing is not as critical. There will be favourable and less favourable half periods, but this will even out.
The power input to the coil could be calculated
In the graph above, the voltage of each bang is visible, and therefore the energy of each one can be calculated according to the usual formula 0,5 * C * U * U that results in energy in joule. If this is done for every bang in the graph, including the low or even non existent bangs, the mean value is then calculated. This mean value, when multiplied by the bps, is the power available at the cap.
In this case the voltage at discharge varies from 0 volts to 28 kV. The average energy at discharge is 35 Joule, based on the data in the graph and the 200 nF cap. That corresponds to 11,5 kW at 331 bps.
Richard Burnett´s resonant charging concept
My HV transformer puts out 12,5 kV rms unloaded, or about 17,5 kV peak. I have tried to design the charging circuit according to mr Burnett´s suggestions.
That must have been successful to some extent, as I would hardly have been able to charge my tank capacitor over the rms value of the transformer, on average, without some inductive kick effect. The average charging voltage in the graph is 18 kV, max value is about 28 kV.
At this point the charging does not seem to be optimised, I should in theory be able to achieve 35 kV at the cap, or with unavoidable losses perhaps 32 kV at best.
How this measurement was made
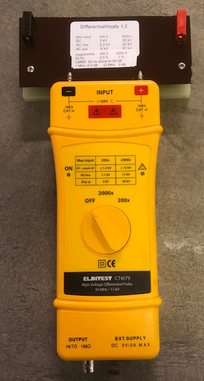
I have used an active differential high voltage probe, Cal Test CT4079. The probe has a max of 15 kV, which is too low for my measurement, so I have doubled up on the input series stage of the voltage dividing network for 30 kV. That was no trivial task, as the voltage dividing network of a HV probe is resistive at low frequency but capacitive at high frequencies.
I did this by taking the input stage from another destroyed and similar probe, and adding that. I will not tell you the story of how that probe was destroyed, that would be too embarrassing, but the good side of the story is that I had another input stage available.
After some fiddling of the capacitor values, I was able to get a flat frequency response and good common mode rejection with the added input stage, and a 30 kV capability.
An indirect method for measuring cap voltage
Measuring voltage at the HV transformer primary
The cap voltage at the HV transformer secondary is very high and therefore not easy to measure. But at the primary side it is much easier.
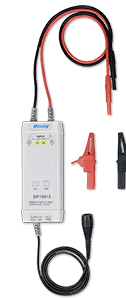
The differential voltage probe to the right is the Micsig DP10013, which is quite cheap. It can be used with an oscilloscope for waveforms or with a meter for steady state voltages. But make shure the scope is connected to mains ground for safety, and be very careful not to handle the measuring leads while connected to mains voltage.
How do primary voltages relate to secondary voltages?
If the no load secondary voltage of the HV transformer is divided by the primary input voltage, the winding factor will be known. For my transformer a primary voltage of 395 V results in 12,5 kV at the secondary, corresponding to a winding factor of 31,6
The secondary voltage is very difficult and dangerous to measure at full input to the primary, so this is generally not done. But the transformer could be measured backwards by applying voltage to the secondary and doing the measuring at the primary. Or the primary can be fed from a 24 V transformer, which results in a more reasonable secondary voltage, that is whithin the range of the Micsig probe.
A measuring error will be introduced in both cases, as the magnetizing current is much lower than normal. But in most cases this error will be quite small.
Primary and secondary measurments compared
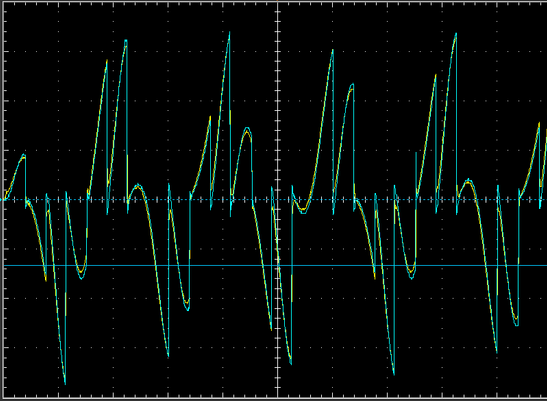
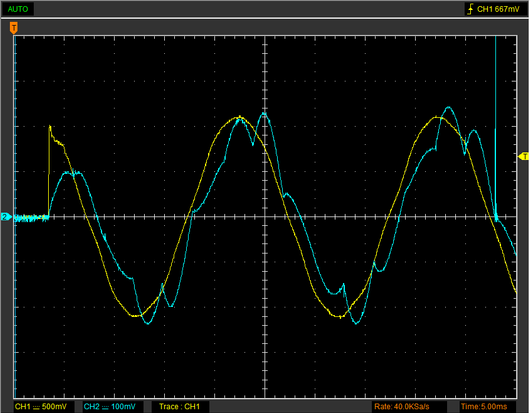
The blue graph to the right is from the secondary side, measured by the Caltest probe, the yellow is from the primary side, measured by the Micsig.
As can be seen, the graphs track very nicely. If the winding factor had been exactely 30, they would theoretically be equal. The winding factor is actually 31,6 but this is to some extent compensated by resistive winding losses.
Measuring cap charging voltage is very useful
As I have showed above, knowledge of the cap charging voltage makes it possible to calculate the actual input power to the coil. It will also be possible to evaluate changes to the charging circuit design.
An efficient design is very much dependent on an optimised resonant charging condition. Changes in primary cap value, bps or ballast inductance can be evaluated against the resulting cap voltage, when this can be measured. I would really like to encourage spark gap coilers to do this.
Input voltage and current from the grid
The yellow graph is input voltage, the blue is input current
The asynchronous rotating sparkgap was set to 340 bps, the ballast tap for 41 A and the contactor was connected at the instant visible on the left side of the time line. That moment was somewhat after the voltage sinus peak, but not by much.
No inrush current
The blue current graph corresponds to 24 A /div. It is interestng that there is no inrush current at all. On the contarary, the first current peak is at less than half the following peak values.
Coilers generally use an expensive and heavy variac for bringing up the voltage and current gradually to the coil. This measurement shows that this is unnecessary, as long as the ballast core is non saturating at start up. Just throw the switch, and the coil starts softly all by itself.
The current lags
One period is 4 divisions, and the blue current graph lags sligtly more than 0,2 division, or about 20 angular degrees at 50 Hz. This could not be converted straight off to a power factor, as there are severe overtones and therefore several frequencies present at once. But it is obvious that the ballast reactance dominates over the capacitor reactance, as the current lags.
I had expected more current
My moving iron current panel meter shows over 50 A, but the scope calculates the rms current to 41 A. The panel meter is designed for 50 Hz only, and can not measure the overtone rich current correctly.
I want to supply more current to the coil, so I will have to reduce the ballast inductance. That will also make the current less lagging, which will put more real power into the coil.
My resonant charging is not yet optimized
I think there are two signs that my ballast inductance is too high for optimal charging. One is that the current is lagging, the other is that there is no tendency for the rate of change of the charging voltage ramp (in the graph at the top of this page) to diminish at the top of the ramp.
The first sign shows that the reactance of the inductor dominates over the reactance of the capacitor, they are not in the balance that they should be. The other sign shows that there is still unused stored energy in the ballast, by the time of the firing.
A lower ballast inductance will hopefully make the charging more resonant, and at the same time supply more current.
In case of a firing safety gap, there will be severe overcurrent
The ballast value that is optimal for the charging, will let very high resistive overload currents pass through. In case of a short over the primary cap, or in case of the safety gap firing, the current will almost only be limited by the ballast inductance.
At the moment my ballast inductance is 15 mH, which has a reactance of 4,7 ohm at 50 Hz. That corresponds to a short circuit current of 85 A at 400 V. If I lower the inductance to 10 mH as planned, this will be 130 A. That is way too much for my local fuses, and also for the fuses at the other end of my incoming cable. And I really want to avoid the latter scenario, as I have no access to those.
So I will probably have to use a combination of very fast acting local knife fuses for the really high short circuit currents, combined with an over current sensing relay for the lower over current range. More on that later.
Resonant charging - no magic
There are 3, or at the most 4 firings of the spark gap, each half period at 50 Hz. These can be seen on the current graph, more clearly when they are at the top of the voltage sinus graph. There is also a visible extra swing after each firing. That is the resonant charging process, as predicted by Richard Burnett. Each time the capacitor is drained of energy, the ballast initially stores energy in it´s magnetic field, and then releases this energy as voltage into the cap.
A mechanic analogy to this is when a weight is suspended hanging from a spring. If the weight is pulled down and then released, it does not only swing back to it´s resting position, but it overshoots this to a bit less than double the distance it was initially pulled down.
This is what happens to the capacitor, it could be charged to a bit less than double the peak output voltage of the HV-transformer. This can be seen in the capacitor voltage graph at the top of this page. The peak voltage of my HV-transformer is about 18 kV, but the cap gets charged to at most 28 kV.
There is no magic about this, the time integrated value of the cap voltage is no higher than the same for the unloaded transformer output voltage. But the peak charging voltage is, and that is what determines the energy content of each bang. Another way of putting this is that a charging circuit without resonance supplies a very bad power factor, and therefore is very inefficient.
The horrible overtones
From the power company´s point of view, a load current that has so prominent overtones as this, constitutes a horrible load. In my case, I am in an industrial environment with very high loads and a stiff grid, therefore I expect my overtones will drown in the much higher general load, so I don´t care too much about these. In a more sensitive environment, where the tesla load would be the dominant one, there could be flicker of fluorescent tubes and all kinds of other nasty problems.
The overtones comes from my bps rate, 340 bps, and also from the charging system resonance. This is determined by the cap and ballast values, and in my case should resonate at about 106 Hz. This will tend towards 120 Hz if I lower the ballast value as planned.
It could be argued that a resonance corresponding to half the bps, that is 170 Hz in my case, would be optimal as that should enable the maximum voltage swing. But i think a somewhat lower frequency might be better, as the rate of change of a full half period sinus ramp is very low at the very top and bottom.
Richard Burnett´s work suggests about 120 Hz for my setup. His recommendations are based on simulations. But I am a bit old school, and prefer to experiment and measure, as I am not very familiar with simulations or advanced mathematics.
Less ballast inductance, more current
More current, more resonance
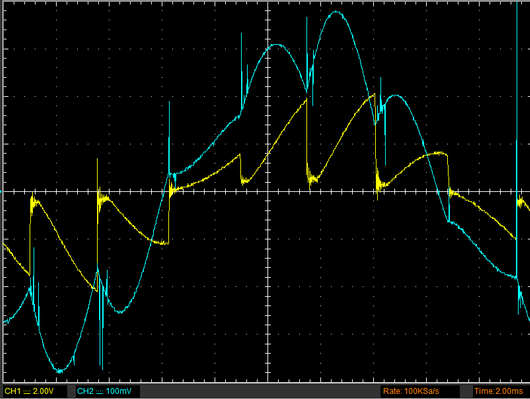
The ballast winding taps were rearranged for 8 mH minimum ballast inductance. The blue graph shows the input current to the HV transformer at 24 A / div, the yellow graph is the input voltage to the transformer, after the ballast.
The peak current value in the graph is about 90 A and the calculated rms current is 57 A. The vertical scale of the graph is the same as the graph above, so they can be compared. The difference, aside from the higher current, is the much larger resonance swings in the graph to the right.
The resonance swings comes from the ballast inductance and the primary cap. This resonance can be calculated to 126 Hz, based on the ballast inductance and the value of the primary cap, when the latter is refered to the primary side of the transformer (200 nF - 200 uF).
This operation is done by squaring the winding factor, in my case 31,6, which results in a factor of 999 multiplied by 200 nF, or 200 uF refered to the primary side.
The mechanism of resonant charging
At the moment when he cap is discharged after each bang, there is no voltage over the cap, all the available voltage is over the ballast. This results in a rising current in the inductor, which builds stored energy in it´s magnetic field. This is the rising part of the resonance swings in the blue graph, and at the same time the voltage over the cap builds up.
When the voltage over the cap equals the voltage over the inductor, the current build up in the inductor stops. This is at the local peaks of the blue graph.
After the local current peak the process reverses, the ballast will be inducing voltage into the cap. That is the falling part of the blue graph, the energy stored in the magnetic field of the inductor is transferred to the cap. This results in a higher charging voltage, the theoretical limit is twice the available peak voltage of the transformer.
This effect is more prominent at the 50 Hz voltage peaks, which can be seen in the graph. There is one period of the mains 50 Hz in the graph.
Richard Burnett´s simulations versus my measurements
Richard Burnett, who pioneered the resonant charging concept, suggests in one diagram 85 Hz charging resonance for my bps, and in another text he states that max power factor would be achieved at about 120 Hz. My ballast/cap combination is resonant at 126 Hz.
In my first measurement, the first graph with the not so prominent resonance swings, the resonance would be about 106 Hz. This results in less resonance and lower cap charging voltages in my former setup.
I think Richard´s suggestion of 120 Hz is most representative of his thinking, the lower recommedation was probably a slip. Initially I thought that a half period of charging resonance between bangs should be the goal, but that does not seem to be the case, neither in my simulations nor in my experiments. On the contrary, Richard´s advice for a lower resonance frequency is confirmed, by simulations as well as by measurement.
How to recognize an optimised charging circuit
Deep notches in the input current graph is a sign of an effective charging circuit. When the notches are deep, most of the energy stored in the ballast magnetic field is transfered as voltage into the cap, which is the goal of the design.
This will also be confirmed by high cap charging voltages, approaching twice the transformer unloaded secondary peak voltage, minus copper losses.